Gentlemen,
There's a lot to get to here, so let's not waste time...
 |
| Total Points Scored |
 |
| Total Points Against |
Above are your full-season Total Points Scored & Against. There may be a few discrepancies with these numbers and Yahoo as I have not included the scoring changes from the past few weeks. As a reminder, these numbers are just the data used to build the analysis.
Also before we get to the Rankings, below are the current Payouts-to-Date for this season.
 |
| Payouts-to-Date |
There is still $700 to be won via 1st, 2nd, and 3rd Place. The bottom 4 are highlighted because their final place in the standings is locked, regardless of what happens in the consolation.
Alright, let's get to the rankings:
 |
| Power Ranking |
I can also say that the group at the top tightened up quite a bit in the last month. There was a time when Dallus/Gow were both running away from the pack, but that is no longer the case.
 |
| All-Play Record |
The All-Play record is the same rankings in a different format, showing what records would be if every team played all opponents every week. You can see that we actually had two ties: 3rd Place (Bill and me) and 6th Place (Kenni and Ned).
What's fairly remarkable about these numbers this year is their general consistency with the final standings. Bill and me are actually a little better than where we ended and Andy/Kenni are a little worse, but we all made the playoffs.
There really isn't anyone that should have been in that isn't, and vice versa. Ned could have an argument, but he was tied for 6th which puts him squarely on the bubble... and that's where he found himself in the last week.
The bottom 3 teams were all much worse than the rest of the league, and each was on their own level. To provide some context, the worse team in our league last year was Ned, who scored a 6.23 on the Power Rankings.
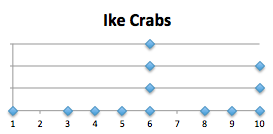
So Crabs had a below average year at 6.46, which would have made him the worst team last year - this year he was 8th.
Whitebread had just a terrible year: 7.15 ties what had previously been the worst team since I started tracking these numbers. Coincidentally, that was Whitey's own record back in 2012.
But Coconuts... my oh my. EIGHT POINT ONE FIVE. That means that on average, he was WORSE than the 3rd worst weekly scorer. Coconuts only had one week when he was in the top half of weekly scorers, which happened to be Week 1. Since then he's always been in the bottom half, and 10 of those weeks he's been in the bottom 3. We really have not given the proper credit to him for how historically bad his team was. We will likely never see a team this bad ever again.
Now... I'm having fun, but context certainly needs to be considered here. Both Whitey and Coconuts mortgaged most of their core players with three weeks left and that plays a role in these numbers. But just a small one...
 |
| Strength of Schedule |
Nothing too notable here, other than (to no one's surprise) Kenni finds good fortune with easy schedule once again. He no doubt is grinning from ear to jewish ear reading this.
One more thing...
I did one more special thing for the year-end: I made dot plots for each team based on their Power Rankings.
They're fairly simple, but here's how to read them: the x-axis is Weekly Rank, and the dots represent the number of times you finished in that spot. For example, if you were Top Point Scorer twice, you should have 2 dots over the 1. So good teams will have dots on the left, and bad teams on the right.
Enjoy.